

Share with your CFO
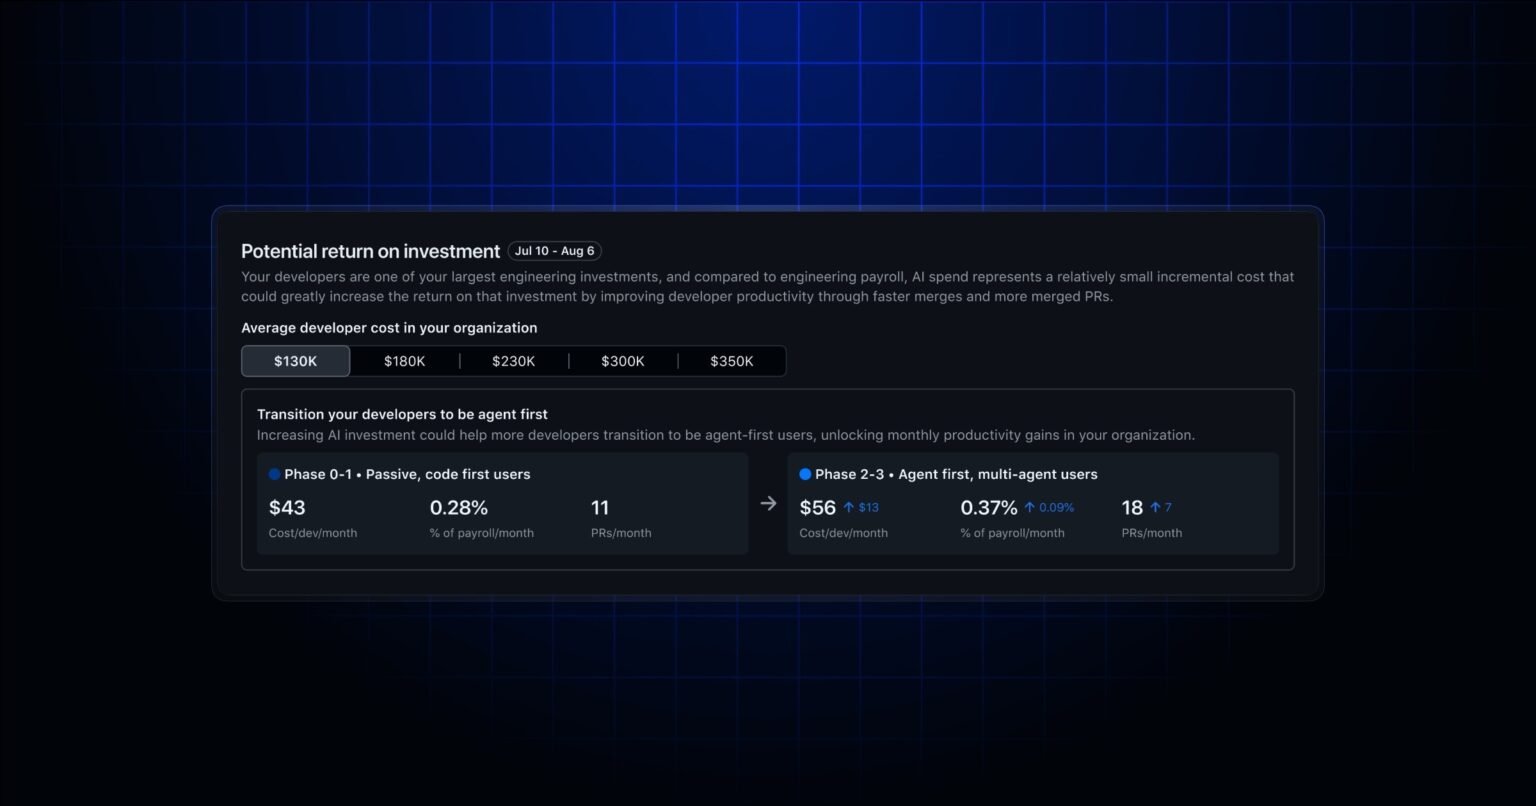
GitHub is turning its Copilot adoption data into a defensible ROI argument, and it’s doing so inside the tool itself. The Copilot impact dashboard’s new return on investment section compares cost per developer per month against pull request output, segmented by adoption depth: passive users in chat and code completion versus agent-first developers running agentic workflows. A salary selector lets finance model those costs against actual compensation bands, making the dashboard something you can pull into a budget review without translating it first.
What this means for your business
The move solves a specific political problem inside enterprises. Engineering leaders have been able to show adoption curves for months, but adoption curves don’t survive a CFO’s first question, which is always some version of “what did we get for that?” By expressing Copilot cost as a percentage of developer payroll and pairing it with pull request volume, GitHub gives budget owners a ratio they can actually argue with, not just a usage chart.
The deeper play here is segmentation by adoption phase. Most enterprise AI tools report aggregate utilization, which flattens the signal. Separating passive users from agent-first developers means a CTO can show the CFO not just that Copilot is being used, but that the developers using it most intensively produce measurably more output per dollar of AI spend. That’s a different conversation than “our adoption rate is 60%.” It’s a productivity curve with a dollar figure attached, and it makes the case for pushing more developers into Phase 2 and Phase 3 rather than treating current adoption as the goal.
The signal worth watching: GitHub is quietly building the infrastructure for AI FinOps, specifically the practice of treating AI tool consumption like cloud spend, with cost attribution, unit economics, and optimization levers. If this dashboard adds cost-per-merged-PR or integrates with procurement data, it stops being a reporting tool and becomes a budget allocation engine. That’s when finance stops reviewing it quarterly and starts watching it weekly.
Concept deep-dive: Adoption phase segmentation
GitHub’s dashboard sorts developers into phases based on how they actually use Copilot: Phase 1 covers chat and code completions, where the developer stays in control and Copilot assists. Phases 2 and 3 describe agentic use, where Copilot autonomously performs multi-step tasks with less human intervention per output. Think of it like the difference between using a calculator and delegating the spreadsheet entirely. The business relevance is that agentic use drives disproportionately higher output, which means phase distribution, not seat count, is the metric that actually predicts ROI.
Based on reporting from Copilot impact dashboard adds a return on investment section, originally published 2026-08-07 17:05:00.