


Share with your CTO
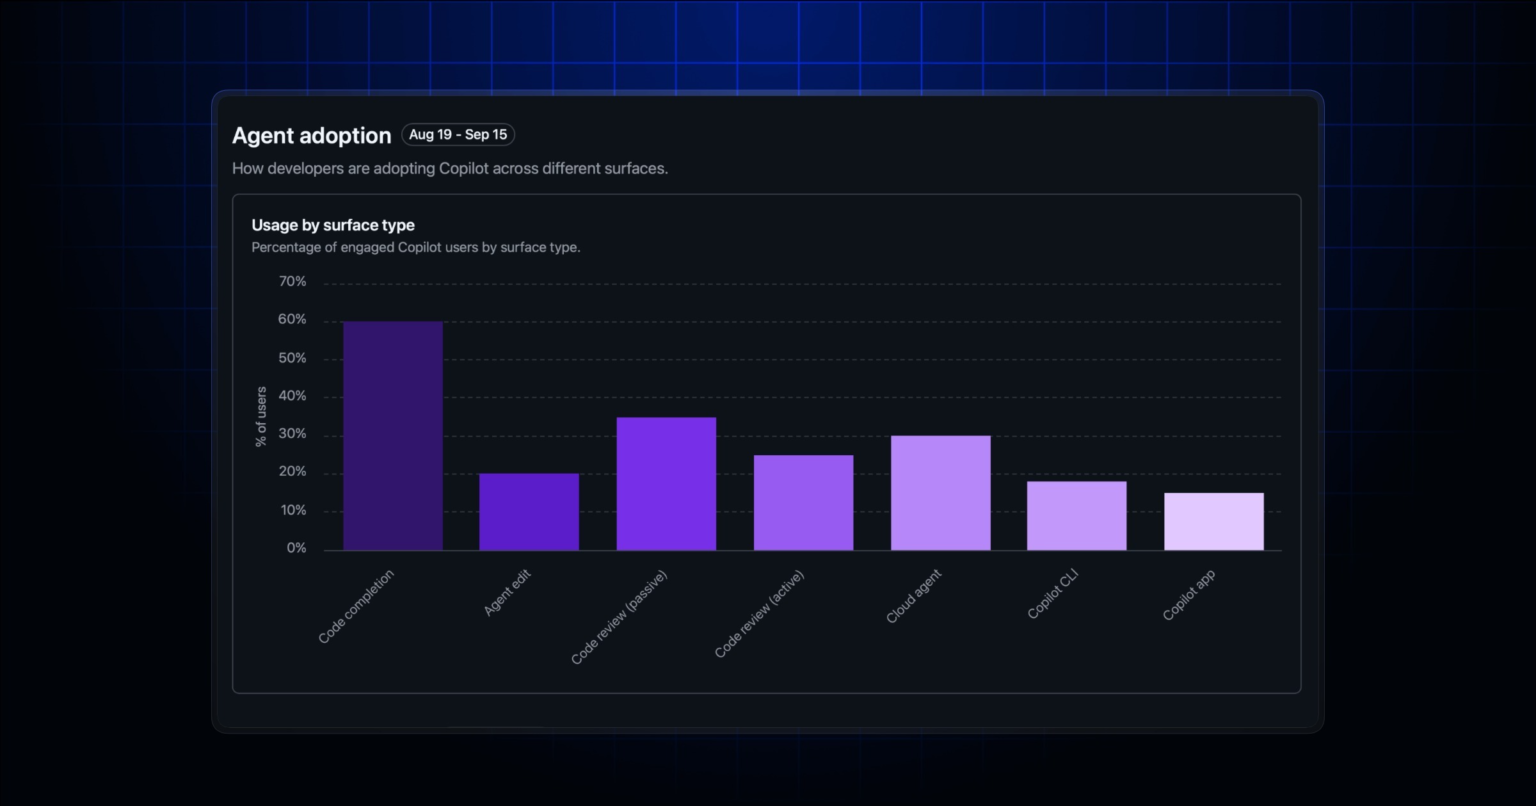
GitHub is turning Copilot’s impact dashboard from a vanity metric display into an actual adoption diagnostic. The Copilot feature engagement update now shows enterprise administrators how many active users regularly engage with specific capabilities, including code completion, agent edit, cloud agent, CLI, and both passive and active code review, across a rolling 28-day window. The same breakdown is now accessible via the enterprise and organization report APIs, giving engineering leaders programmatic access to adoption data without manual dashboard checks.
What this means for your business
The practical problem GitHub is solving here is real. Enterprises pay per seat for Copilot and routinely discover, months in, that a significant portion of licensed users have never touched most features beyond basic autocomplete. Without feature-level engagement data, the only available signal is aggregate active-user counts, which can look healthy while the actual capability adoption is nearly flat. Now you can see that 400 developers are “active” but only 60 have ever triggered an agent edit.
The distinction between passive and active Copilot code review is worth holding onto. Passive review means Copilot was automatically assigned to a pull request without the developer engaging with it. Active review means a developer deliberately requested Copilot’s input or acted on its suggestions. These two behaviors have completely different implications for whether AI is actually changing how your engineering org works, or just running in the background generating ignored output. Conflating them in a single metric, as most tools do, flatters adoption numbers without informing behavior change.
The signal worth watching: GitHub is quietly building the measurement infrastructure that makes Copilot’s ROI case easier to defend at budget review. Feature-level engagement data lets engineering leaders construct a specific argument, “we’re paying for eight capabilities and using three well, so here’s the targeted enablement plan,” rather than the vague productivity improvement narrative that CFOs have started tuning out. The question is whether your team will actually use this data to drive enablement programs, or treat it as another dashboard nobody opens.
Concept deep-dive: AI adoption phases
GitHub’s adoption phase framework classifies developers into stages based on how deeply they’ve integrated Copilot into their workflow, moving from initial exposure through regular feature use. The new users_in_phase_28d field reports the full rolling 28-day population in each phase, not just users who happened to be active on a single day. Think of it like the difference between knowing how many gym members showed up today versus how many worked out at least twice this month. For engineering leaders, this is the difference between measuring a snapshot and measuring a behavioral pattern.
Based on reporting from Copilot impact dashboard now shows feature engagement, originally published 2026-09-17 17:47:00.